{"searchBar":{"inputPlaceholder":"Search by keyword or ask a question","searchBtn":"Search","error":"Please enter a keyword to search"}}
{}
{"support":{"yesButton":"Yes","noButton":"No","feedback":{"title":"What can we do to improve?"},"submitButton":"Submit","successMessage":"Thank you for your feedback","title":"Did this answer your question?","feedbackPercentLabel":"of people found this helpful","captcha":{"error":"Please check the box"}}}
Search FAQs
Can I scale the Historical Trend Graph?
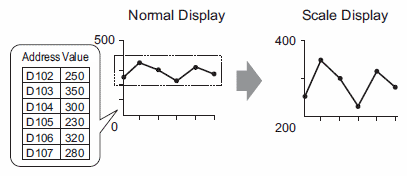
You can show the display scale of the Historical Trend Graph in accordance with the specified range. (Show Scale) When data are converged in a certain range, it is useful for verifying details.
NOTE
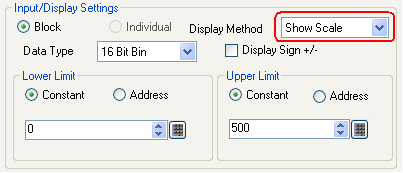
Specifying [Show Scale] allows you to draw three auxiliary lines of [Upper Limit], [Standatrd], and [Lower Limit] on the graph.