Displaying Alarm
Display Alarms
To view created alarms on the display unit, use the Alarm Summary object. With the Alarm Summary object you can check the state and other information of generated alarms.
The alarm summary object displays data stored in the specified [Save in] field. If you set [Operate When [Save in] is Full] to [Overwrite Old Data], deleted data is not displayed. Note that alarms and system errors of alarm groups that may not be displayed in the Alarm Summary object can also cause the number of alarm history records to exceed the [Maximum Records], resulting in the removal of data.
Display Format
The Alarm Summary object has the following display formats (alarm modes).
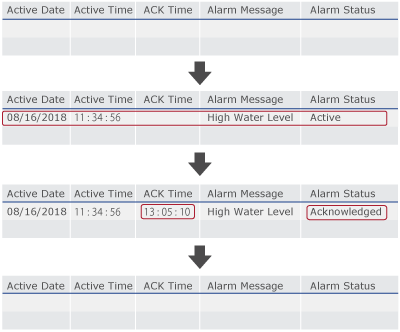
- [Active]
Displays each alarm on a single line. Changes in alarm state update the information in that line.
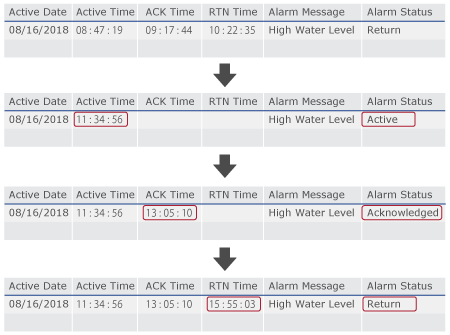
If you enable the [ExceptRTN] option, when an alarm is restored the corresponding alarm message is removed from the Alarm Summary.
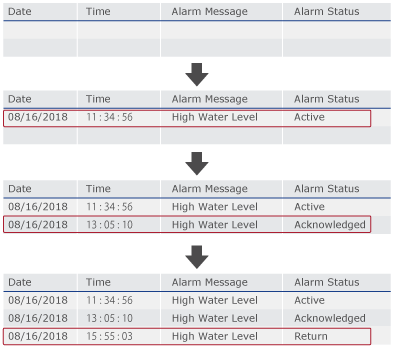
- [Historical]
Displays a triggered alarm on a single line until it is returned to normal. When the alarm becomes active again, displays the alarm on a new line.
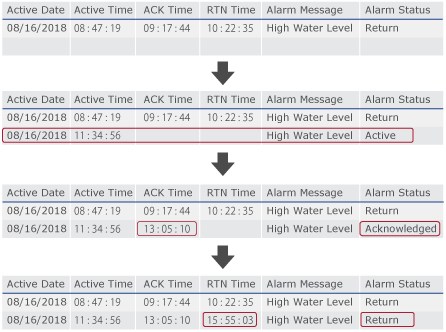
In [Historical] view, the maximum number of lines in the alarm summary object is 4000.
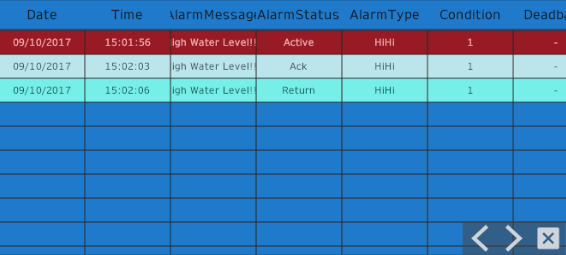
- [Log]
Keeps a history of all generated alarms. A change in alarm state adds a new line to the display.
Relationship between Alarm Database and Alarm Summary Object
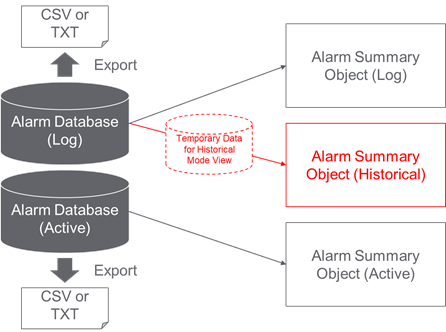
When using [Log] view or [Active] view
Alarm summary object displays alarm data directly from the alarm database (log) or alarm database (active).
When using [Historical] view
- When starting run time, temporary data is generated from the alarm database (log). Alarm summary object displays alarms in the temporary data. As new alarms are triggered, entries are added to both the alarm database (log) and temporary data.
- You can export alarm data in log view and active view.
You cannot export alarm data in historical view because there is no
historical alarm database.
Display Items
You can display the following information in the Alarm Summary object.
Title |
Description |
[Active] | [Historical] | [Log] |
[Date] |
The date of each alarm's state is displayed. Customize the format of the displayed date and time. From the Alarm Summary object's Property window, in the [Function] → [Detail] → [Column] → [Date] → [Converter Parameter] → [Pattern] enter optional formats. For formats you can set, see the following. |
- |
- |
|
[Time] |
The time is displayed for each alarm state. |
- |
- |
|
[Active Date] |
Displays the date when the alarm becomes active. |
|
|
- |
[Active Time] |
The time is displayed when the alarm becomes active. |
|
|
- |
[ACK Date] |
Displays the date when the alarm is acknowledged (hereafter referred to as "ACK"). |
|
|
- |
[ACK Time] |
The time is displayed when the alarm is acknowledged (hereafter referred to as "ACK"). |
|
|
- |
[RTN Date] |
Displays the date when the alarm is recovered (hereafter referred to as "RTN"). |
|
|
- |
[RTN Time] |
The time is displayed when the alarm is recovered (hereafter referred to as "RTN"). |
|
|
- |
[Alarm Message] |
The alarm message is displayed. |
|
|
|
[Alarm Status] |
The status of the alarm is displayed. Active, ACK, Return and UNACK. |
|
|
|
[Alarm Type] |
The alarm type is displayed: LoLo, Lo, Hi, and HiHi. |
|
|
|
[Condition] |
The limit that was exceeded by the variable to trigger an alarm is displayed. |
|
|
|
[Deadband] |
The alarm deadband value is displayed. |
|
|
|
[Target Variable] |
The Variable name to monitor and trigger the alarm is displayed. |
|
|
|
| [Group Name] | The alarm group name is displayed. |
|
|
|
| [Value] | The variable's value data set when the alarm is active, acknowledged, recovered or unacknowledged. | - |
- |
|
| [Active Value] | The variable's value set for the alarm that is active is displayed. |
|
|
- |
[Equipment Name] |
The source of variable is displayed. The source of variable is set at [Source] property of the variable. |
|
|
|
[Alarm Severity] |
The severity of the alarm is displayed. |
|
|
|
[Alarm Count] |
The number of times the alarm was triggered is displayed. |
|
- |
- |
| [ACK Count] | The number of times the alarm was acknowledged is displayed. |
|
- |
- |
| [UNACK Count] | The number of times the alarm was unacknowledged is displayed. |
|
- |
- |
[Elapsed Time] |
The total amount of time for which the alarm was in the triggered state is displayed. |
|
- |
- |
| [Time to be ACKed average] | The average acknowledged time is displayed. |
|
- |
- |
| [Time to be RTNed average] | The average amount of time for an alarm to recover (return to normal). |
|
- |
- |

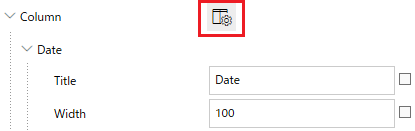
- You can set whether to show or hide items in the Alarm Summary
object. Open the Property window for the Alarm Summary object,
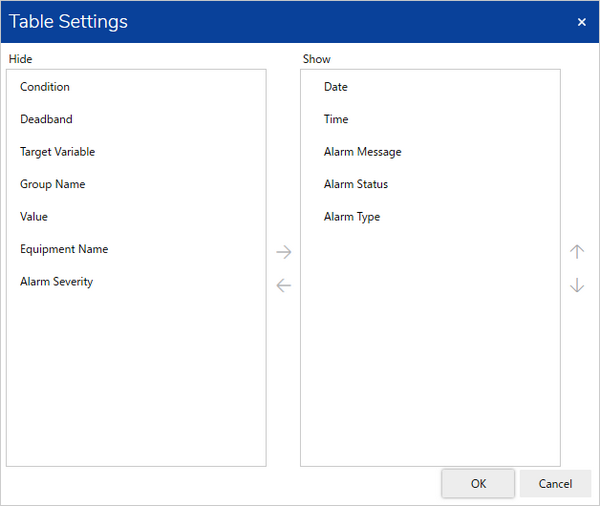
and click the [Table Settings] icon identified with the red frame.
In the [Table Settings] dialog box, select items to display in the Alarm Summary object.
- You can change the column width of each item. From the
Alarm Summary object's Property window, in the [Column] group,
define the number of pixels for the column [Width] of each item.
Enter an asterisk (*) in the [Width] field to automatically adjust the column width to accommodate display data. Widths set up with an asterisk are calculated by subtracting the column width of all the other items.
(Example)
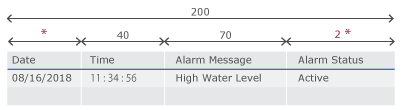
* + 2* = 200 - (40 + 70) = 90
* = 30
Results in Date column of 30 and Alarm State column width of 60.
About Severity
By selecting [Severity] in the [Color Mode], you can show an icon to the high severity alarms displayed on the Alarm Summary object.
| Severity | Alarm [Severity] Setting Value | Icon Displayed in Alarm Summary |
| High
|
1 |  |
| 2 |  |
|
| 3 |  |
|
| 3 or greater | Displays the value set as the [Severity]. |
About Sub Screens
You can touch an alarm and display its associated sub screen. The displayed sub screen is Content set up with the same value as the value of the Alarm Group or alarm's [Parameter] property.
Touch an alarm and the following decision tree is executed.
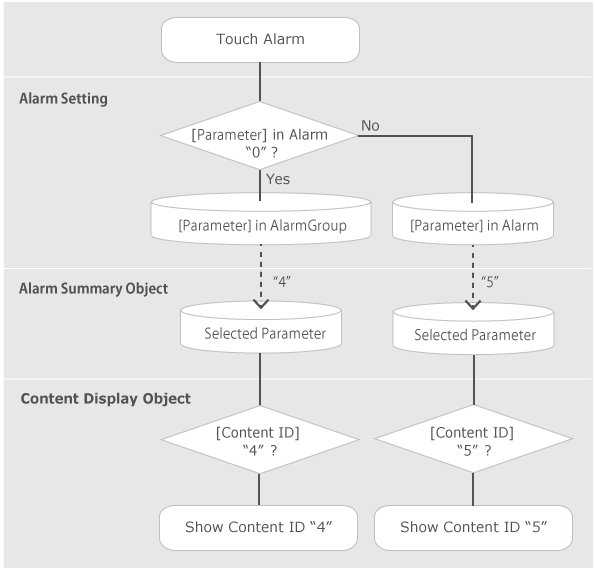
For setting details, refer to the following.
Using Parameters to Display Screens
About Display Multiple Groups
You can check the state of multiple alarm groups with one Alarm Summary object. From the Alarm Summary object's Property window, in the [Alarm Group] list select all the alarm groups you want to view.
[Color Mode]
Based on a condition, you can change the Alarm Summary object background color and font color from [Color Mode].
- [State]
The background color and font color changes depending on the alarm state. - [Severity]
The background color and font color changes depending on the alarm severity. The background and the font color depend on the [Severity] property of each alarm.