Displaying Logging Data in Trend Graphs
Displays collected logging data in a Trend Graph. You can set up the display method for logging data with the Trend Graph object properties.
- Channels
- Display Mode
- Graph Type
- Scroll Percentage
- Display Historical Data
- Changing Date and Time Format
- Status of Data
- About Display Performance of Trend Graphs
[Channels]
The maximum number of channels (number of lines) that can be displayed on a Trend Graph object is 32.
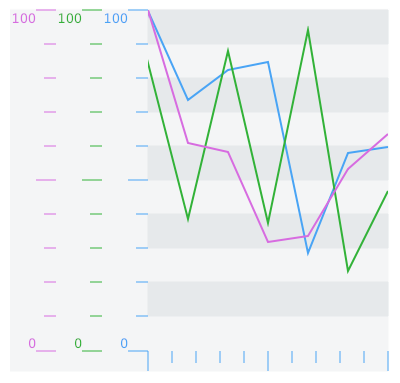
[Display Mode]
| [Full] | The channels are plotted on the entire graph area.
 |
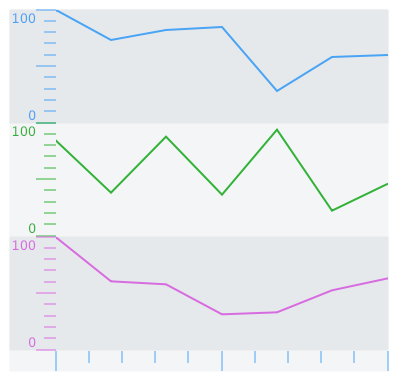
| [Divide] | The channels are plotted on the divided graph area.
 |
[Graph Type]
| [Normal] | The latest data is added to the graph right. When the graph
line reaches the limit of the display area, the graph is scrolled.
|
| [Pen Recorder] | The latest data always appears at the right edge of the display
area.
|
[Scroll Percentage]
[Display Historical Data]
Display both historical data and current data.
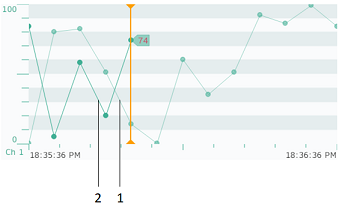
1: Historical data
2: Current data
Changing Date and Time Format
You can type your own Date/Time format.
To change the Date/Time format:
Select the Trend Graph object.
In the Properties window, go to [Function] tab ➞ [Detail] tab.
Click [Time Scale] and type the format in the [Format] field.
Status of Data
Depending on the status of data, an icon may appear or a part of the graph color changes to gray.
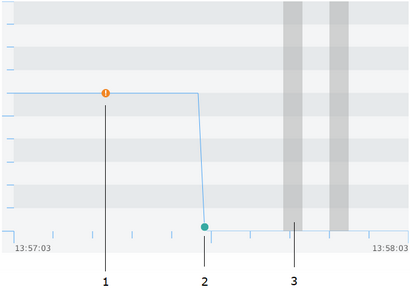
1: Communication error occurred
2: Communication recovered
3: Power failure or there is an interlock
About Display Performance of Trend Graphs
Displaying a large amount of data may slow down the updating of trend graphs and may degrade the performance of the runtime itself.
You can improve trend graph display performance by considering the following.
Number of Display Data
Reduce the number of data displayed in the trend graph.
Example 1: Reduce the number of channels displayed.
Example 2: Extend the data collection period.
Trend Graph Size
Reduce the size of trend graphs drawn on the screen.
Variable Type
When possible, use internal variables rather than external variables.
Number of elements in array
When using array variables, reduce the number of array elements.
Number of logging data
Reduce the maximum number of logging data records.
Maximum Number of Records for Logging Data
Clear the logging data.