Displaying an Alarm for Variable Values in Bar Graphs
You can display an Alarm for variable values in a bar graph.
To create a bar graph, use a [Rectangle] object and below [Animation], the [Fill Level] property. Also, use the scale converter to align variable values with values displayed in the graph, and the range converter to change the display color when there is an alarm.
Example Operation
Setting Workflow
Add Variables
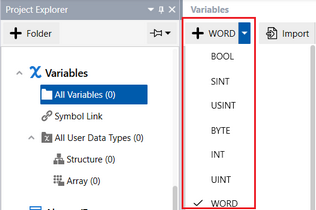
Project Explorer : [Variables] ➞ [All Variables]
Add the below variable(s).
Variables property:
| [Name] | [Data Type] |
Var1 |
[USINT] |
Set Up Converter
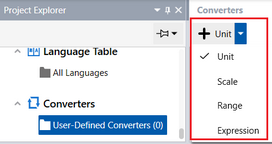
Project Explorer : [Converters] ➞ [User-Defined Converters]
Add the below converter(s).
| [Name] | [Type] |
Converter1 |
[Range] |
Converter2 |
[Scale] |
Converter1 property:
| Tab | Property | Value | |
[Basic] |
[Data Type (Source)] | [Numeric] | |
| [Data Type (Result)] | [ColorID] | ||
| [Range] | 2 | ||
| [Range1] | [Data (Input)] | 200 | |
| [Operator] | > | ||
| [Value] | 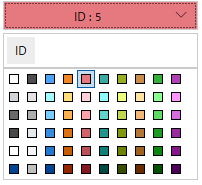 |
||
| [Else Condition] | [Value] | 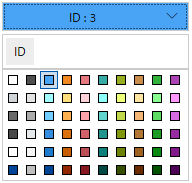 |
|
Converter2 property:
| Tab | Property | Value |
[Basic] |
[Maximum (Source)] | 255 |
| [Maximum (Output)] | 100 | |
| [Minimum (Source)] | 0 | |
[Minimum (Output)] |
0 |
Set Up Parts/Shapes
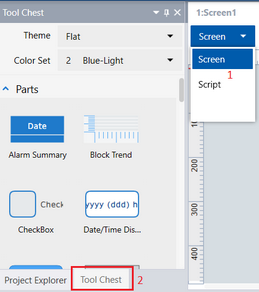
Project Explorer : [Screen Design] ➞ [Screens] ➞ [Screen1]
Drag and drop the following objects from the [Tool Chest] to the screen.
Bar Scale (Name: BarScale1) properties:
| Tab | Sub Tab | Property | Value | |
[Shape] |
[Text] |
[Scale Label] |  |
|
| [Label Attribute] | [Minimum] | 0 | ||
| [Maximum] | 255 | |||
Rectangle (Name: Rectangle1) properties:
| Tab | Sub Tab | Property | Value | ||
| [Shape] | [Basic] |
[Fill] |
[Value] |  [Variable]
[Name]: Var1
[Converter]:
[User-Defined Converters] ➞ [Converter1] [Variable]
[Name]: Var1
[Converter]:
[User-Defined Converters] ➞ [Converter1] |
|
[Border] |
[Type] | [None] | |||
[Size/Location] |
[Animation] |
[Fill Level] | [Enable] | |
|
| [Vertical Fill] | [Variable]
[Name]: Var1
[Converter]:
[User-Defined Converters] ➞ [Converter2] |
||||
Numeric Display (Name: NumericDisplay1) properties:
| Tab | Sub Tab | Property | Value |
[Function] |
[Basic] |
[Current Value] | [Variable]
[Name]: Var1 |