Displaying Variable Values in Bar Graphs
You can display variable values in a bar graph.
To create a bar graph, use a [Rectangle] object and the below [Animation], the [Fill Level] property. Also, use the scale converter to align variable values with values displayed in the graph.
Example Operation
Setting Workflow
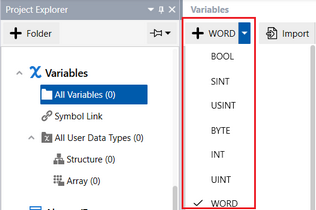
Add Variables
Project Explorer : [Variables] ➞ [All Variables]
Add the below variable(s).
Variables property:
| [Name] | [Data Type] |
Var1 |
[USINT] |
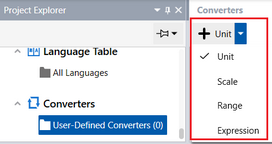
Set Up Converter
Project Explorer : [Converters] ➞ [User-Defined Converters]
Add the below converter(s).
| [Name] | [Type] |
Converter1 |
[Scale] |
Converter1 property:
| Tab | Property | Value |
[Basic] |
[Maximum (Source)] | 255 |
| [Maximum (Output)] | 100 | |
| [Minimum (Source)] | 0 | |
[Minimum (Output)] |
0 |
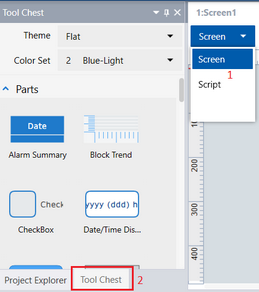
Set Up Parts/Shapes
Project Explorer : [Screen Design] ➞ [Screens] ➞ [Screen1]
Drag and drop the following objects from the [Tool Chest] to the screen.
Bar Scale (Name: BarScale1) properties:
| Tab | Sub Tab | Property | Value |
[Shape] |
[Text] |
[Scale Label] |  |
Rectangle (Name: Rectangle1) properties:
| Tab | Sub Tab | Property | Value | ||
| [Shape] | [Basic] |
[Border] |
[Type] | [None] | |
[Size/Location] |
[Animation] |
[Fill Level] | [Enable] | |
|
| [Vertical Fill] |  [Variable]
[Name]: Var1
[Converter]:
[User-Defined Converters] ➞ [Converter1] [Variable]
[Name]: Var1
[Converter]:
[User-Defined Converters] ➞ [Converter1] |
||||
Numeric Display (Name: NumericDisplay1) properties:
| Tab | Sub Tab | Property | Value |
[Function] |
[Basic] |
[Current Value] | [Variable]
[Name]: Var1 |